График позиции
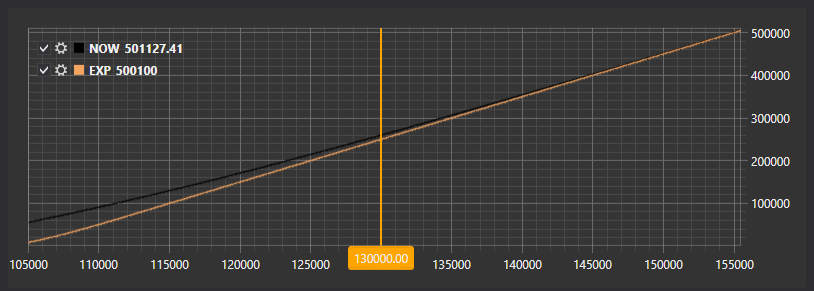
Графический компонент OptionPositionChart - это график, показывающий позицию и греки опционов относительно базового актива.
Далее показан пример SampleOptionQuoting, в котором используется этот график. Исходные коды примера можно найти в папке Samples/06_Strategies/09_LiveOptionsQuoting.
Пример SampleOptionQuoting
В коде XAML добавляем элемент OptionPositionChart и присваиваем ему имя PosChart.
<Window x:Class="OptionCalculator.MainWindow"
        xmlns="http://schemas.microsoft.com/winfx/2006/xaml/presentation"
        xmlns:x="http://schemas.microsoft.com/winfx/2006/xaml"
        xmlns:loc="clr-namespace:StockSharp.Localization;assembly=StockSharp.Localization"
        xmlns:xaml="http://schemas.stocksharp.com/xaml"
        Title="{x:Static loc:LocalizedStrings.XamlStr396}" Height="400" Width="1030">
    <Grid Margin="5,5,5,5">

     .........................................................

     <xaml:OptionPositionChart x:Name="PosChart" Grid.Row="7" Grid.Column="0" Grid.ColumnSpan="6" />
 </Grid>
</Window>
В коде C# создаем подключение и подписываемся на необходимые события.
...
public readonly Connector Connector = new Connector();
...
// subscribe on connection successfully event
Connector.Connected += () =>
{
 // update gui labels
 this.GuiAsync(() => ChangeConnectStatus(true));
};
// subscribe on disconnection event
Connector.Disconnected += () =>
{
 // update gui labels
 this.GuiAsync(() => ChangeConnectStatus(false));
};
// subscribe on connection error event
Connector.ConnectionError += error => this.GuiAsync(() =>
{
 // update gui labels
 ChangeConnectStatus(false);
 MessageBox.Show(this, error.ToString(), LocalizedStrings.ErrorConnection);
});
// fill underlying asset's list
Connector.SecurityReceived += (sub, security) =>
{
 if (security.Type == SecurityTypes.Future)
 	this.GuiAsync(() => _assets.TryAdd(security));

 if (_model.UnderlyingAsset == security || _model.UnderlyingAsset.Id == security.UnderlyingSecurityId)
 	_isDirty = true;
};
// subscribing on tick prices and updating asset price
Connector.TickTradeReceived += (sub, trade) =>
{
 if (_model.UnderlyingAssetId == trade.SecurityId)
 	_isDirty = true;
};
Connector.PositionReceived += (sub, position) => this.GuiAsync(() =>
{
 var asset = SelectedAsset;
 if (asset == null)
 	return;
 var assetPos = position.Security == asset;
 var newPos = position.Security.UnderlyingSecurityId == asset.Id;
 if (!assetPos && !newPos)
 	return;
 if ((PosChart.Model != null && PosChart.Model.UnderlyingAsset == position.Security)
 	|| PosChart.Model.InnerModels.Any(m => m.Option == position.Security))
 	RefreshChart();
});
try
{
 if (_settingsFile.IsConfigExists(_fileSystem))
 	Connector.LoadIfNotNull(_settingsFile.Deserialize<SettingsStorage>(_fileSystem));
}
...
При подключении задаем первоначальные установки контрола:
- Обнуляем модель OptionPositionChart.Model контрола;
- Перерисовываем график с начальными значениями OptionPositionChart.Refresh(System.Nullable<System.Decimal> assetPrice, System.Nullable<System.DateTime> currentTime, System.Nullable<System.DateTime> expiryDate );
- Задаем провайдера сообщений для рыночных данных и инструментов.
private void ConnectClick(object sender, RoutedEventArgs e)
{
 if (!_isConnected)
 {
 	ConnectBtn.IsEnabled = false;
 	...
 	PosChart.Model = null;
 	PosChart.Model = new BasketBlackScholes(Connector, Connector);
 	Connector.Connect();
 }
 else
 	Connector.Disconnect();
}
При получении инструментов добавляем базовые активы в список.
Connector.SecurityReceived += (sub, security) =>
{
 if (security.Type == SecurityTypes.Future)
 	this.GuiAsync(() => _assets.TryAdd(security));
};
При получении инструментов и тиковых сделок устанавливаем флаг _isDirty. Это позволяет в событии таймера (код которого опущен) вызывать метод RefreshChart (см. ниже) для перерисовки графика. Таким образом мы контролируем частоту перерисовки.
Connector.SecurityReceived += (sub, security) =>
{
 if (_model.UnderlyingAsset == security || _model.UnderlyingAsset.Id == security.UnderlyingSecurityId)
 	_isDirty = true;
};
// подписываемся на событие тиковых сделок чтобы обновить текущую цену фьючерса
Connector.TickTradeReceived += (sub, trade) =>
{
 if (_model.UnderlyingAssetId == trade.SecurityId)
 	_isDirty = true;
};
В обработчике события получения позиции вызываем перерисовку графика.
Connector.PositionReceived += (sub, position) => this.GuiAsync(() =>
{
 var asset = SelectedAsset;
 if (asset == null)
 	return;
 var assetPos = position.Security == asset;
 var newPos = position.Security.UnderlyingSecurityId == asset.Id;
 if (!assetPos && !newPos)
 	return;
 if ((PosChart.Model != null && PosChart.Model.UnderlyingAsset == position.Security)
 	|| PosChart.Model.InnerModels.Any(m => m.Option == position.Security))
 	RefreshChart();
});
Метод вызывает перерисовку графика.
private void RefreshChart()
{
 var asset = SelectedAsset;
 var trade = asset.LastTick;
 if (trade != null)
 	PosChart.Refresh(trade.Price);
}